
Perhaps one of the most widely-used stock analysis tools is the price-to-earnings ratio, or P/E. This perpetual prophesier of profit has been used for ages by analysts and still remains one of the most relevant pieces of stock valuation. A simple P/E ratio can reveal the stock's real market value and how the valuation compares to its industry group or a benchmark like the S&P 500 Index. Investors will find that an understanding of this financial term is priceless in properly communicating to other investing professionals.
Comparing Doughnut ShopsOne way to tell if a stock is over or undervalued is to compare it to its sector or industry group. Sectors are made up of industry groups and industry groups are made up of stocks with similar businesses. Industry groups tend to come into favor, which means the price for one doughnut shop rises then most other doughnut shop prices rise. For instance, if some anti-Atkins doctor was to release the "Doughnut Diet" and it caused a new sensation of demand for doughnuts, then every doughnut shop would likely benefit.
In most cases, an industry group will benefit during a particular phase of the business cycle and therefore many professional investors will concentrate on an industry group when their turn in the cycle is up. Remember that the P/E is a measure of expected earnings. Near the end of a period of economic expansion, inflation will usually become a problem; however, basic materials and energy companies will have higher earnings because of the better price they'll get for the commodities they harvest. Toward the end of an economic recession, interest rates will usually be low and consumer cyclical stocks will usually expect higher earnings, because consumers may be more willing to purchase on credit because rates is low.
There are numerous examples of when P/Es will be expected to rise on a particular industry group. An investor could look for stocks within an industry group that is coming into favor and find those with the lowest P/Es as a way to determine which are the most undervalued.
Relative P/EWhen a company is in its growth phase, it will usually trade with a much higher P/E than a more mature company would. However, by comparing the current P/E to a company's historical P/E, investors could determine if the stock is trading higher or lower compared to the past.
If the stock is at the higher end of its range, the likelihood of the stock being overvalued is much greater, whereas, if the stock has a P/E at the lower end of its range, then there is a greater likelihood of it being undervalued. Because of the way companies grow, this isn't always as reliable as one may hope. Therefore, investors may choose to only use approximately 10 years of P/E to keep the range in better perspective.
Fundamental and technical analysts have been looking at historical P/Es for over 100 hundred years. Charles Dow noted in his observations, that later became known as Dow Theory, that the bottom of a bear market commonly coincided with P/E ratios on the Dow Jones Industrial Average below 10. Financial bubbles have expanded P/E ratios over time to higher highs (see Figure 1). A quick observation of P/E ratios of the S&P 500 since the late 1800s shows that the average P/E ratio for the S&P 500 is approximately 15 and a P/E above 20 may be considered overvalued for the benchmark index.
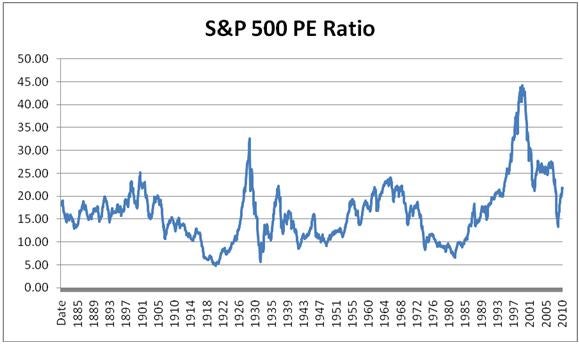 |
| Figure 1: S&P 500 PE Ratio |
| Source: Investools.com |
The Rising Demand of DoughnutsIn the end, P/E ratios matter most depending on a person's expectation of earnings. Referring back to the doughnut shop example, if our doughnut shop was located in the less-than-thriving metropolis of Neola, Utah and the customers are mostly farmers and ranchers, you would likely view the P/E of 20 to be too expensive because future growth is limited. However, if the doughnut shop is in downtown Chicago where a new high school and police station are being built right next door, than you would likely feel that the future earnings growth is excellent and the doughnut shop is a bargain.
Looking at P/E in terms of future earnings growth can be done with a PEG ratio. The PEG ratio is the earnings divided by the five-year earnings growth rate (there can be variations of the growth rate estimate). For example, a company that has a P/E ratio of 10 and a five-year growth rate of 40%, would have a PEG ratio of 0.25. A PEG ratio of one or lower is considered to be an undervalued stock and likely a good buy.
Value investors who like to purchase stock with dividends may choose to use the PEGY ratio to determine if a stock is undervalued. The PEGY ratio is similar to the PEG ratio, but factors in the dividend yield. Investors will also look for stocks with a PEGY of one or lower.
PEGY Ratio = (P/E Ratio / Growth Rate + Dividend Yield)These two ratios will help investors utilize P/E ratios to find excellent investing opportunities.
by Ryan Campbell


