by Candy Schaap
Profit potential is increased when a trader understands and uses pivots. The term pivot refers to a turning point in the price of an asset and often coincides with key levels of support and resistance. There are two basic types of price pivots: calculated pivots (those determined by using mathematical formula) and price pivots, which are determined by looking at the price action on a chart. In this article we'll introduce price pivots and show how they can be successfully implemented into an active trading strategy.
Types of Pivots
A calculated pivot, often called a floor trader pivot, is derived from a formula using the previous day's high, low and closing price. The result is a focal price level about which price action is likely to turn, either up or down.Calculated pivots represent potential turning points in price, while price pivots are actual historic turning points.
Price pivots are not calculated. The pivot is defined by the structural relationship between price bars. Price pivots form on all time frames, are building blocks of trend and provide objective entry and exit points for trading.
Price pivots are best conceptualized with three bars. A three-bar pivot low represents support and is formed when buying pressure turns price from down to up. It is designated by a price bar with a higher low that closes above the previous bar's high, where the previous bar's low is lower than the bar that preceded it. This is true in every time frame.
A three-bar pivot high represents resistance and is formed when sellers turn price from up to down. It is seen where a price bar with a lower high closes below the previous bar's low, where the previous bar's high is higher than the bar that preceded it. Structural pivots are more easily recognized and understood when seen in a diagram or on a price chart. This is true in every time frame. (See Figure 1)
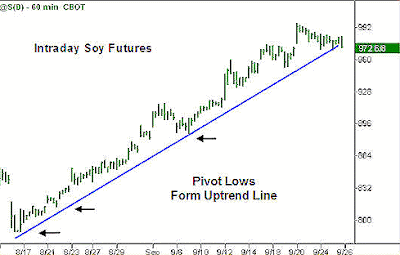
Price pivots represent reversals and are the building blocks of trend. A series of lower pivot highs and lower pivot lows is a downtrend, and the pivot highs are connected to form a down trendline. A series of higher pivot lows and higher pivot highs is an uptrend, and the pivot lows are connected to form an up trendline, as shown in Figure 2.
Strategic Uses for Price Pivots
Pivots are also essential for seeing when the trend changes to the opposite direction. A trend reversal is seen by a change in the sequence of pivots. A downtrend will have a series of lower highs and lower lows, and a down trendline is drawn on the pivot highs. Once there is a higher high and higher low, there is presumptive evidence of a trend reversal to the upside (Figure 3).
The strength of the signal is increased when the higher pivot low forms above the down trendline. Aggressive traders can enter at the closing price on the same day the higher low completes the pivot formation.
| Source: Tradestation |
| Figure 3: Downtrend reversal in Nasdaq futures. The higher pivot low triggers a reversal in the uptrend. This signal is strengthened when the higher pivot low closes above a descending trendline. CONTINUE... |


