
When volume is low but gains and loss are big, the professionals are most likely getting overly excited about a possible turn in market direction. That's because many have been taught that without strong volume, a market move is not valid. Here we look at how to interpret volume and the principles behind this doing so.
Simple but Powerful
Volume, volume, volume – it is the indicator at which chartists constantly look to determine whether or not a move in the markets, a sector or a single issue has conviction. It may also be the easiest of all indicators to understand. Add the number of shares traded in a given period, and you have the answer. It requires no weightings or exotic mathematical formulas. It simply indicates enthusiasm or lack thereof for an issue, and it has nothing to do with the price of the.
To confirm a market turnaround or trend reversal, the technical analyst must determine whether or not the measurements of price and volume momentum agree with each other. If they do not, it is a sure indicator of weakness in the trend, and thus a trend reversal may be well on the horizon. If we have a look at volume from the standpoint of momentum, we see a recognizable level of buying and selling activity.
The Oscillator
A volume oscillator measures volume by measuring the relationship between two moving averages. The volume oscillator indicator calculates a fast and slow volume moving average. The difference between the two (fast volume moving average minus slow volume moving average) is then plotted as a histogram. The fast volume moving average is usually over a period of 14 either days or weeks. The slow volume moving average is usually 28 either days or weeks. On a regular basis, analysts argue over whether or not the lengths of these time periods are appropriate. Some say that 14 and 28 are too conservative while others argue these numbers are not conservative enough.
Here we use use 5/20 like a short-term trader. The histogram, like an oscillator, fluctuates above and below a zero line. Volume can provide insight into the strength or weakness of a price trend. This indicator plots positive values above the zero line and negative values below the line. A positive value suggests there is enough market support to continue driving price activity in the direction of the current trend. A negative value suggests there is a lack of support, that prices may begin to become stagnant or reverse.
Interpretation
If a market is rallying, the volume oscillator should rise. When the issue becomes overbought, the oscillator will reverse its direction. If the market is declining or moving in a horizontal direction, the volume should contract. Always keep in mind that we are measuring changes in volume, and volume expands during a sell-off. It is important to note that an increasing price together with declining volume is always, without exception, bearish. When the market is at the top, one would therefore see an oversold volume chart. Another important fact is that rising volume together with declining prices is also bearish.
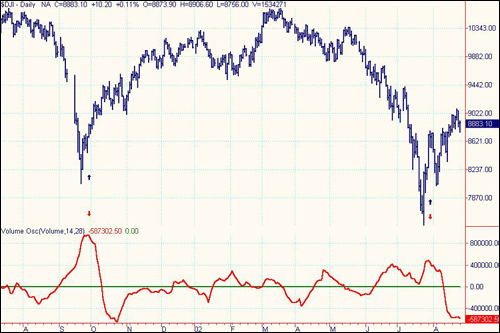
A look at the chart of the Dow Jones Industrial Average from Aug 2001 to Aug 2002 shows two significant run-ups in the volume oscillator after equally significant slides. The first is a result of the activity after Sept 11 and the subsequent market turnaround on Sept 21. The second is the result of the most recent fall-off this summer and the turnaround of over 1,500 points over the past three weeks or so.
For the first case, you can see that the volume increased dramatically when the market collapsed on the re-open of the exchanges on Sept 17, 2001. The Dow then witnessed very low volumes with the rising market after the bounce on Sept 21. Volumes were low mostly because investors were still in shock; only the most steely-nerved investors got back in. The second case occurs in line with annual summer market conditions where, for the most part, the institutional players are gone for the month of August; furthermore, the pundits find little excitement, because of a lack of volume, when the market moves daily 100 points in either direction.
Remember, it's your money - invest it wisely.
Simple but Powerful
Volume, volume, volume – it is the indicator at which chartists constantly look to determine whether or not a move in the markets, a sector or a single issue has conviction. It may also be the easiest of all indicators to understand. Add the number of shares traded in a given period, and you have the answer. It requires no weightings or exotic mathematical formulas. It simply indicates enthusiasm or lack thereof for an issue, and it has nothing to do with the price of the.
To confirm a market turnaround or trend reversal, the technical analyst must determine whether or not the measurements of price and volume momentum agree with each other. If they do not, it is a sure indicator of weakness in the trend, and thus a trend reversal may be well on the horizon. If we have a look at volume from the standpoint of momentum, we see a recognizable level of buying and selling activity.
The Oscillator
A volume oscillator measures volume by measuring the relationship between two moving averages. The volume oscillator indicator calculates a fast and slow volume moving average. The difference between the two (fast volume moving average minus slow volume moving average) is then plotted as a histogram. The fast volume moving average is usually over a period of 14 either days or weeks. The slow volume moving average is usually 28 either days or weeks. On a regular basis, analysts argue over whether or not the lengths of these time periods are appropriate. Some say that 14 and 28 are too conservative while others argue these numbers are not conservative enough.
Here we use use 5/20 like a short-term trader. The histogram, like an oscillator, fluctuates above and below a zero line. Volume can provide insight into the strength or weakness of a price trend. This indicator plots positive values above the zero line and negative values below the line. A positive value suggests there is enough market support to continue driving price activity in the direction of the current trend. A negative value suggests there is a lack of support, that prices may begin to become stagnant or reverse.
Interpretation
If a market is rallying, the volume oscillator should rise. When the issue becomes overbought, the oscillator will reverse its direction. If the market is declining or moving in a horizontal direction, the volume should contract. Always keep in mind that we are measuring changes in volume, and volume expands during a sell-off. It is important to note that an increasing price together with declining volume is always, without exception, bearish. When the market is at the top, one would therefore see an oversold volume chart. Another important fact is that rising volume together with declining prices is also bearish.
 |
| Chart Created with Tradestation |
A look at the chart of the Dow Jones Industrial Average from Aug 2001 to Aug 2002 shows two significant run-ups in the volume oscillator after equally significant slides. The first is a result of the activity after Sept 11 and the subsequent market turnaround on Sept 21. The second is the result of the most recent fall-off this summer and the turnaround of over 1,500 points over the past three weeks or so.
For the first case, you can see that the volume increased dramatically when the market collapsed on the re-open of the exchanges on Sept 17, 2001. The Dow then witnessed very low volumes with the rising market after the bounce on Sept 21. Volumes were low mostly because investors were still in shock; only the most steely-nerved investors got back in. The second case occurs in line with annual summer market conditions where, for the most part, the institutional players are gone for the month of August; furthermore, the pundits find little excitement, because of a lack of volume, when the market moves daily 100 points in either direction.
Remember, it's your money - invest it wisely.
Investopedia,com


