(by Candy Schaap)
The primary objective of the trend trader is to enter a trade in the direction of the trend.
The directional movement indicator (also known as the directional movement index - DMI) is a valuable tool for assessing price direction and strength. This indicator was created in 1978 by J. Welles Wilder, who also created the popular relative strength index. DMI tells you when to be long or short. It is especially useful for trend trading strategies because it differentiates between strong and weak trends, allowing the trader to enter only the strongest trends. DMI works on all time frames and can be applied to any underlying vehicle (stocks, mutual funds, exchange-traded funds, futures, commodities and currencies). Here, we'll cover the DMI indicator in detail and show you what information it can reveal to help you achieve better profits.
DMI Characteristics
DMI is a moving average of range expansion over a given period (default 14). The positive directional movement indicator (+DMI) measures how strongly price moves upward; the negative directional movement indicator (-DMI) measures how strongly price moves downward. The two lines reflect the respective strength of the bulls versus the bears. Each DMI is represented by a separate line (Figure 1). First, look to see which of the two DMI lines is on top. Some short-term traders refer to this as the dominant DMI. The dominant DMI is stronger and more likely to predict the direction of price. For the buyers and sellers to change dominance, the lines must cross over.
A crossover occurs when the DMI on bottom crosses up through the dominant DMI on top. Crossovers may seem like an obvious signal to go long/short, but many short-term traders will wait for other indicators to confirm the entry or exit signals to increase their chances of making a profitable trade. Crossovers of the DMI lines are often unreliable because they frequently give false signals when volatility is low and late signals when volatility is high. Think of crossovers as the first indication of a potential change in direction.
| Source: TDAmeritrade Strategy Desk Figure 1: The +DMI and -DMI are shown as separate lines. There are several false crossovers ( Point 1) and one crossover at Point 2 that leads to an uptrend with +DMI dominant. Note: The calculations for DMI are complicated and are referenced elsewhere. Also, DMI is normally plotted in the same window with the ADX indicator, which is not shown. |
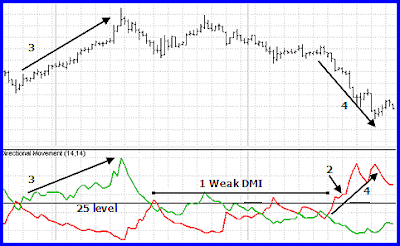
DMI is used to confirm price action (see Figure 2). The +DMI generally moves in sync with price, which means that the +DMI rises when price rises, and it falls when price falls. It is important to note that the -DMI behaves in the opposite manner and moves counter-directional to price. The -DMI rises when price falls, and it falls when price rises. This takes a little getting used to. Just remember that the strength of a price move up or down is always recorded by a peak in the respective DMI line. Reading directional signals is easy. When the +DMI is dominant and rising, price direction is up. When the -DMI is dominant and rising, price direction is down. But the strength of price must also be considered. DMI strength ranges from a low of 0 to a high of 100. The higher the DMI value, the stronger the prices swing. DMI values over 25 mean price is directionally strong. DMI values under 25 mean price is directionally weak.
| Source: TDAmeritrade Strategy Desk Figure 2: DMI is weak at Point 1 and price is choppy. The +DMI rises strongly above 25 at Point 2 and the uptrend follows. Note how +DMI moves with price at Point 3 and -DMI moves counter-directional to price at Point 4. |


