Short Trades
Lets see how this setup works on both the long and short time frames.
Let's look at a long setup in GBP/USD, which begins to form on November 12, 2005, notice that prices first rally but then begin to drop, setting up for a possible double bottom. According to the rules of our setup, we take half our position at 1.7386, expecting prices to bounce back up. When this setup is traded on the daily charts, the stops can be enormous. In the case of this long setup the stop is more than 500 points large. The amplitude of the counter-move up is 1.7907-1.7386 = 521 points.
We use a symmetrical approach to determine risk. Using our double-top example, we measure the amplitude of the retrace in the double top and then add that value to the swing high to create our zone of resistance.
As the trade proceeds, we see that the support at 1.7386 fails; we therefore place a second buy order at 1.7126, halfway below our ultimate stop of 1.6865. We now have a full position on and wait for market action to respond. Sure enough, having expended so much effort on the downside move, prices begin to stall way ahead of our ultimate stop. As the price bounces back, we sell the one lot, which we purchased at 1.7126, back at 1.7386, our initial entry point in the trade, banking 260 points for our efforts. We then immediately move our stop on the remaining lot to 1.7126, ensuring that the trade will lose us no capital should the price fail to rally to our second profit target. However, on November 23, 2005, the price does reach our second target of 1.7646, generating a gain of another 260 points for a total profit on the trade of 521 points. Therefore, what could wind up as a loss under most standard setups because support was broken by a material amount turns into a profitable, high probability trade.
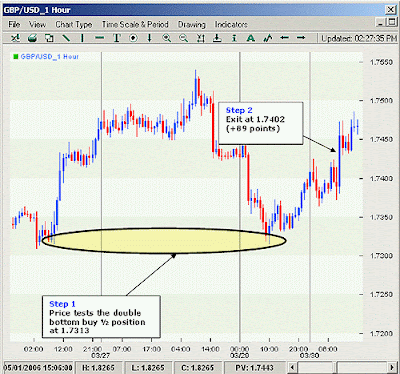
Now let's take a look at the setup on a shorter time frame using the hourly charts. In this example, the GBP/USD traces out a countertrend move of 177 points that lasts from 1.7313 to 1.7490. The move starts at approximately 9 a.m. EST on March 29, 2006, and lasts until 2 p.m. EST the following day. As the price trades back down to 1.7313, we place a buy order and set our stop 177 points lower at 1.7136. In this case, the price does not retreat much more, leaving us with only the first half of the position as it creates a very shallow fake out double bottom.
We take our profits at 50% of risk, exiting at 1.7402 at 8 p.m. EST on April 3, 2006. The trade lasts approximately four days, with very little drawdown, and produces a healthy profit in the process. On the shorter time frames, the risk of this setup is considerably less than the daily version, with the ultimate stop only 177 points away from entry, versus the prior example where the stops were 521 points away.


