(ChartAdvisor.com)
Profitable Pattern Number One
The Symmetrical Triangle: A Reliable Workhorse
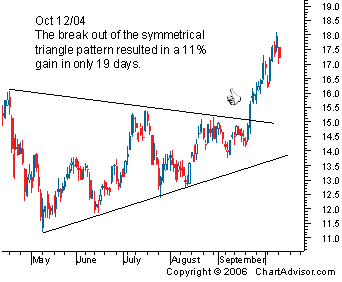
You’ll recognize the symmetrical triangle pattern when you see a stock’s price vacillating up and down and converging towards a single point. Its back and forth oscillations will become smaller and smaller until the stock reaches a critical price, breaks out of the pattern, and moves drastically up or down.
The symmetrical triangle pattern is formed when investors are unsure of a stock’s value. Once the pattern is broken, investors jump on the bandwagon, shooting the stock price north or south.
| Symmetrical Triangle Pattern
|
How to Profit from Symmetrical Triangles
Symmetrical triangles are very reliable. You can profit from upwards or downwards breakouts. You’ll learn more about how to earn from downtrends when we talk about maximizing profits.
If you see a symmetrical triangle forming, watch it closely. The sooner you catch the breakout, the more money you stand to make.
Watch For:
• Sideways movement, a period of rest, before the breakout.
• Price of the asset traveling between two converging trendlines.
• Breakout ¾ of the way to the apex.
Set Your Target Price:
As with all patterns, knowing when to get out is as important as knowing when to get in. Your target price is the safest time to sell, even if it looks like the trend may be continuing.
For symmetrical triangles, sell your stock at a target price of:
• Entry price plus the pattern’s height for an upward breakout.
• Entry price minus the pattern’s height for a downward breakout.
ChartAdvisor Symmetrical Triangles in Action
ChartAdvisor has a long history of identifying symmetrical triangle patterns. Over the last two and one-half years, ChartAdvisor has brought to its readers over 20 symmetrical triangle patterns. That’s an average of one every month and a half.
Our readers earned an amazing 40% profit on our Nortel Networks Inc (NT) pick. Those who followed our call on Rochester Medical Corp (ROCM) in September of 2004 earned 15% in 33 days. And in October of 2004, our members earn 11% in 19 days when ChartAdvisor noticed Pan American Silver Corp (PAAS).
Our members earned 11% in 19 days on the PAAS symmetrical triangle pattern.


