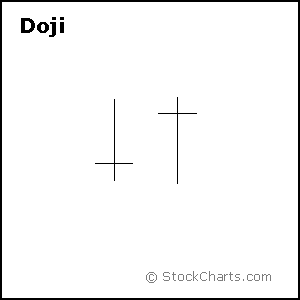
Doji are important candlesticks that provide information on their own and as components of in a number of important patterns. Doji form when a security's open and close are virtually equal. The length of the upper and lower shadows can vary and the resulting candlestick looks like a cross, inverted cross or plus sign. Alone, doji are neutral patterns. Any bullish or bearish bias is based on preceding price action and future confirmation. The word "Doji" refers to both the singular and plural form.
Ideally, but not necessarily, the open and close should be equal. While a doji with an equal open and close would be considered more robust, it is more important to capture the essence of the candlestick. Doji convey a sense of indecision or tug-of-war between buyers and sellers. Prices move above and below the opening level during the session, but close at or near the opening level. The result is a standoff. Neither bulls nor bears were able to gain control and a turning point could be developing.
Different securities have different criteria for determining the robustness of a doji. A $20 stock could form a doji with a 1/8 point difference between open and close, while a $200 stock might form one with a 1 1/4 point difference. Determining the robustness of the doji will depend on the price, recent volatility, and previous candlesticks. Relative to previous candlesticks, the doji should have a very small body that appears as a thin line. Steven Nison notes that a doji that forms among other candlesticks with small real bodies would not be considered important. However, a doji that forms among candlesticks with long real bodies would be deemed significant.
Doji and Trend
The relevance of a doji depends on the preceding trend or preceding candlesticks. After an advance, or long white candlestick, a doji signals that the buying pressure is starting to weaken. After a decline, or long black candlestick, a doji signals that selling pressure is starting to diminish. Doji indicate that the forces of supply and demand are becoming more evenly matched and a change in trend may be near. Doji alone are not enough to mark a reversal and further confirmation may be warranted.
After an advance or long white candlestick, a doji signals that buying pressure may be diminishing and the uptrend could be nearing an end. Whereas a security can decline simply from a lack of buyers, continued buying pressure is required to sustain an uptrend. Therefore, a doji may be more significant after an uptrend or long white candlestick. Even after the doji forms, further downside is required for bearish confirmation. This may come as a gap down, long black candlestick, or decline below the long white candlestick's open. After a long white candlestick and doji, traders should be on the alert for a potential evening doji star.
After a decline or long black candlestick, a doji indicates that selling pressure may be diminishing and the downtrend could be nearing an end. Even though the bears are starting to lose control of the decline, further strength is required to confirm any reversal. Bullish confirmation could come from a gap up, long white candlestick or advance above the long black candlestick's open. After a long black candlestick and doji, traders should be on the alert for a potential morning doji star.
Long-Legged Doji
Long-legged doji have long upper and lower shadows that are almost equal in length. These doji reflect a great amount of indecision in the market. Long-legged doji indicate that prices traded well above and below the session's opening level, but closed virtually even with the open. After a whole lot of yelling and screaming, the end result showed little change from the initial open.


